We’re studying polynomial functions in my Enhanced Math 3 class right now, and I love it. There’s just something about the predictable nature of their graphs… but really, I think it’s because I am in love with this card sort.
I originally created this card sort as part of a conference presentation tracing the progression of standards on linear functions from 6th grade ratios to derivatives in Calculus; we stopped on polynomial functions along the way, focusing on the relationships between the linear factors of a polynomial and key features in its graph. I was serving as Teacher on Special Assignment at the time, so I had no classroom and no students to test out this lesson, but the teachers that attended our sessions really enjoyed the task.
This is now the third year that I’ve used it with students, and I think I made it even better by creating “task cards” for each round of the card sort, like the one below.

I had done this card sort successfully with teachers several times, but the night before I first used this with students, I worried that students wouldn’t look as closely at the equations and graphs to notice the patterns in the behaviors near the zeros (my ultimate goal for task #1). So I added an additional incorrect graph and equation pair for them to find. I thought this was brilliant *pats self on the back* … my students, of course, found the wrong graph in about 2 seconds (it’s card G7, shown below).

“We just plugged in numbers. The y-intercept in the graph is positive, but it’s supposed to be negative.” (oops… so much for looking closely)
The question I really needed to ask was “Now that you’ve found the incorrect graph, what’s wrong with it? How can you fix it?” Some groups needed more nudging than others, but ultimately every group figured out a pattern and adjusted the equation accordingly:
“The (x+2) is squared so it should look like a parabola around -2, and (x-4) is cubed so it should look like a cubic around 4. We would change the exponents so that (x+2) is cubed and (x-4) is squared and then it would match the graph.”
This year, with the addition of the task cards, I formalized this as a checkpoint question at the end of the first task. I borrowed this strategy from a complex instruction task shared by Rick Barlow. When a team tells me that they are ready for the next task, I ask one person at random(ish) in the team the question. If they answer correctly, the team gets the next task; if they answer incorrectly, I reiterate that every member of the team must be able to answer the question, they need to get together to ensure that is true, and I’ll return again when they’re ready.
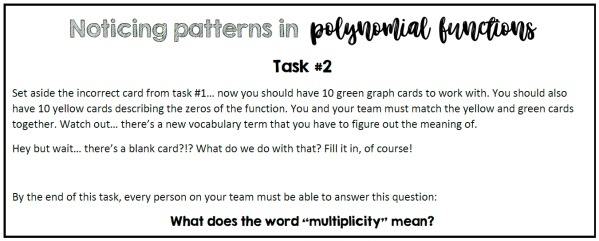

In task #2, students have to match the zeros to the graph and figure out what the word “multiplicity” means. This task (and the remaining tasks) employs my favorite card sort hack: the blank card. If there are 10 cards to match, I leave one card blank so that students have to apply what they’ve learned to create their own card for the remaining match. This pushes students to be less passive during the card sort.
Tasks #3 and #4 are similar to task #2 in that they have sets of 10 cards to match, with one blank card in each set. These cards focus on the degree and end behaviors of the graphs, and the intervals on which the function is increasing/decreasing and positive/negative.


Exit slip: Students had to create an equation to match a graph projected on the board and ask at least one question, either something that confused them or a “what-if” question they want to explore further. Every student was able to identify the correct zeros and multiplicity, and almost all identified that the leading coefficient should be negative given the end behavior of the graph. Most of the questions they had pertained to the leading coefficient and y-intercept, which we had not really addressed in this task, but I knew we would confirm in the next class.
What I love most about this task is that students are able to discover all of these patterns in polynomial functions. I did absolutely no direct instruction; I monitored student progress and nudged them along by asking questions or focusing their attention on particular cards.
This was only the second day of this unit. On the first (short) day, we completed this task from Illustrative Mathematics. In the days following this card sort, we did a Connecting Representations task that I created (more about the Connecting Representations routine here and here) and some practice with graphing and writing equations of polynomial functions, before going into any of the algebraic techniques traditionally associated with polynomials: factoring, long/synthetic division, possible rational roots, irrational and non-real roots, etc.
Resources: Card sort (PDF, word doc) and task cards (PDF, word doc)
I love sharing ideas… if you try out this task with your students, please let me know how it goes in the comments below or on twitter! @kristiedonavan
Shoutout to Rick Barlow – the complex instruction tasks you share on twitter give me great ideas for how to improve my own class structures.
Shoutout to Sara Van Der Werf – did anyone catch it? Look at task #1 again… I steal all my best ideas from her. The reason I created this task in the first place is because I need students to see it before I show them. 🙂
Shoutout to Martha Barrett – thank you for your unwavering support and for working with me to build our Linear Functions Roadmap presentation.

One thought on “My favorite lesson: Introducing polynomial functions”